Background
Voter registration statuses are typically classified into three ordered categories:
- Active: Voters are fully eligible to participate in elections, either by casting their ballot at a polling place or by mail, without any additional steps. Their votes are guaranteed to be fully counted.
- Inactive: Voters are required to update their information or provide verification before being allowed to vote. In some states, inactive voters retain the same rights and provisions as active voters; however, the "inactive" status serves as a warning that the registration is progressing toward removal unless corrective action is taken.
- Removed: Voters are no longer listed on the voter roll and are ineligible to vote unless they re-register. While most states require re-registration to be completed several days before the election, a few states allow same-day registration.
The primary federal law governing voter registration in the United States is the federal National Voter Registration Act (NVRA) [11]. The NVRA mandates that states conduct regular voter list maintenance to ensure the accuracy of their registration records. These maintenance programs must be uniform, non-discriminatory, and compliant with the Voting Rights Act [11]. While states have discretion in managing their list maintenance procedures, the NVRA establishes specific guidelines for voter removal.
Under the National Voter Registration Act (NVRA), there are specific conditions under which a voter can be removed from the registration rolls. These include the following scenarios:
- The voter submits a request for removal.
- The voter has passed away.
- The voter relocates beyond the area covered by the jurisdiction, in which case the removal must adhere to procedures outlined by the NVRA.
- The voter is found to be mentally incapacitated, contingent on state law requirements.
- The voter is convicted of a crime that disqualifies them from voting, again dependent on state legislation.
By setting these standards, the NVRA aims to balance election integrity with voter access, ensuring that only eligible voters remain on the rolls while preventing improper disenfranchisement.
Election officials in each state—sometimes at the county or local level—may decide which specific tools and methods to use when determining whether a voter should be designated as inactive or removed from voter rolls. For example, in Ohio, each county is responsible for processing various voter registration transactions, including resolving duplicate registrations, verifying records against motor vehicle databases, processing online registrations, and other related tasks [12]. The state provides a unified voter registration system that connects to each county office through secure online communication. Additionally, the state office establishes administrative rules in compliance with federal and state laws, following best practices recommended by the U.S. Election Assistance Commission [13]. The best practices include the use of the following.
Government Records: Officials use data from several government sources such as a state’s motor vehicle registry, the Social Security Administration for death records, and state departments that manage criminal records [13]. This helps in identifying voters who have died, moved out of the jurisdiction, or are otherwise ineligible to vote due to felony convictions or mental incapacitation.
Mailings and Returned Mail: States and local jurisdictions often send mail to voters' registered addresses. If mail is returned undeliverable, it can indicate that the voter no longer resides at the registered address [13]. This is one of the most common methods for identifying inactive voters or those who have moved.
Cross-State Data Sharing: Programs like the Electronic Registration Information Center (ERIC) allow states to share information and cross-check voter registrations [14]. ERIC helps identify voters who have moved between states or who have died, using data shared among member states.
Confirmation Notices: Under the National Voter Registration Act (NVRA), states send confirmation notices to voters who have not participated in voting for a certain period [13]. If voters fail to respond to these notices and do not participate in subsequent elections, they can be moved to an inactive list and eventually removed if no activity is recorded over two federal general elections.
Election Activity: States monitor voter activity such as voting in elections, signing petitions, or updating voter registration details [13]. Lack of such activity can trigger further investigation into a voter's eligibility.
The U.S. Election Assistance Commission's survey of election officials on the 2020 election highlighted the diverse range of data sources states use to identify and remove ineligible voters from their rolls [2]. The most commonly cited source, used by 93 percent of states, is death records from state vital statistics offices. Reports from other states notifying election officials that a former resident has registered elsewhere are also widely relied upon (89 percent), as are direct removal requests from voters (86 percent). Many states also utilize felony and prison records (82 percent) and undeliverable election mail (70 percent) to flag potentially ineligible registrations. Less frequently used sources include newspaper death notices (66 percent), National Change of Address (NCOA) reports [15] (59 percent), and data from interstate data-sharing agreements (57 percent). Additionally, some states reference Social Security Administration death records (57 percent) and undeliverable mailed ballots (55 percent) in their voter list maintenance efforts. Other methods, even less commonly used, include records from motor vehicle agencies (46 percent), documentation of individuals declared mentally incompetent (43 percent), and applications for mailed ballots (27 percent). These findings highlight the diversity of approaches states take to ensure election integrity.
As described, there is no universally accepted formula for utilizing specific data sources in voter roll maintenance. There is also no established benchmark for an acceptable error rate in improper voter removals. Courts and independent analysts have played a crucial role in determining when the number of removals is excessive or when the process disproportionately impacts certain groups.
For example, in 2019, the Wisconsin Elections Commission (WEC) mailed notices to over 200,000 voters as part of its list maintenance efforts, informing them that they were believed to have moved [16]. Two years earlier, the WEC had analyzed voting outcomes among individuals who received similar mailings after being flagged as having moved based on data from ERIC and NCOA. The findings showed that 58 percent of these voters did not respond—some had indeed moved out of state, while others took no further action to vote that year. About 25 percent re-registered at a new address within the state. Six percent updated their registration at the same address, indicating an error rate for voters mistakenly identified as having moved when they had not. At the municipal level, Milwaukee reported a slightly higher error rate: seven percent of Milwaukee voters were incorrectly flagged as having relocated [17].
Interviews with impacted voters revealed several instances where government records inaccurately indicated that a voter had moved when, in fact, they had not [17]. Common discrepancies included instances where a voter’s registration address contained a unit number, used different spellings, or had abbreviations that did not match those on their driver's license or other official records. Additionally, younger voters, particularly college students, often considered their permanent residence to be their voter registration address, even if other records showed they temporarily lived on campus or elsewhere. In some states, college students must register their motor vehicles in the state where they attend school, but they may maintain their home address in their originating state as their official voter registration address. These and other systemic inconsistencies contribute to erroneous voter removals.
A legal challenge arose when a complaint argued that all voters flagged by ERIC or NCOA should be removed from the rolls four weeks after notification, despite acknowledging an erroneous removal rate of at least four percent [18]. WEC, concerned about the potential for wrongful removals, declined to execute immediate removals and instead increased the duration of inactive status for those registrations. The case moved through the courts, culminating in a state Supreme Court ruling that the state election office was not obligated to remove voters flagged by ERIC and NCOA as having moved [19]. The ruling suggested two additional takeaways: four weeks is an insufficient timeframe for voters to respond to being removed, and a four percent erroneous removal rate was too high for best practices in voter list maintenance [19].
Independent data analysts have also played a crucial role in identifying unacceptably high error rates in voter roll maintenance. In 2019, Ohio planned to remove 235,000 voters from its rolls under the assumption that they had moved or died [20]. To enhance transparency, the state publicly released the names and addresses of these voters in advance, rather than executing the removals privately without public disclosure of the specific individuals affected. A data analyst scrutinized the list and alerted election officials to errors. As a result, Ohio officials acknowledged that approximately 20 percent of the names should not have been slated for removal [20], highlighting the importance of external oversight in maintaining the accuracy of voter roll maintenance processes.
In recent years, states have withdrawn from ERIC for a combination of political, ideological, and structural reasons, despite its being a primary means to improve voter roll accuracy by identifying voters who moved out of state or died [21][22]. Wisconsin continues to be a member, but Ohio is not [23]. The departure of multiple states from ERIC threatens the efficiency of cross-state voter registration maintenance, potentially leading to outdated voter rolls, increased risks of fraud, and greater administrative burdens for election officials.
Building on these prior experiences, this study examines the accuracy of announced and scheduled voter removals in Ohio during the 2024 election cycle by evaluating how many removed voters reappeared on the rolls by Election Day. Since these individuals took corrective action to maintain their registration, their reappearance serves as a baseline indicator of the number of eligible voters mistakenly targeted for removal.
Ohio 2024
On June 5, 2024, the Ohio Secretary of State publicly released a list of 158,857 voter registrations slated for removal from the state's voter rolls within seven weeks [24], as part of preparations for the 2024 November election.
“These registrations are eligible for removal under the law because records show they’ve been inactive or the individuals no longer reside at the registered address for at least the last four consecutive years,” said the Ohio Secretary of State at the time. (See [25] for the referenced law.)
According to the Ohio Secretary of State, the voter registrations fell into two categories:
- Voters who submitted a National Change of Address form indicating a permanent move, making them ineligible to vote at their former address [15].
- Inactive registrations previously flagged for removal but not yet deleted from a county’s voter registration system.
The Ohio Secretary of State instructed county boards to remove any registrations not sufficiently updated by July 22, 2024. A person on the list could restore their inactive status to active before the deadline by:
- Confirming or updating their voter registration online at VoteOhio.gov, by mail, or in person.
- Engaging in voter activity, such as updating their address, submitting an absentee ballot application, or signing a verified candidate or issue petition.
Given the transparency of Ohio’s announced voter removal list, previous high-profile cases of the reinstatement of erroneously flagged voters, the sharp rise in the number of voter removals, and the decline of ERIC, we might reasonably expect Ohio’s 2024 erroneous removal rate to be at or above four percent—the minimum threshold highlighted in the Wisconsin case in 2019. The following sections provide a detailed calculation of the actual erroneous removal rate for Ohio’s announced 2024 removal list and describe the demographics, geography, and outcomes of the voters slated for removal.
Results
Results are reported below in nine sections:
- Ohio Voter Data, Analysis of Overall Counts
- Tracking Changes in Voter Data by VoterID
- Subjects: Residences
- Subjects: Political Party Affiliation
- Subjects: Identification
- Subjects: Age Information
- Subject Tracking by VoterID
- Subject Tracking by Name and Date of Birth
Erroneous Removal Rate
I. Ohio Voter Data, Analysis of Overall Counts
The Ohio Voter Data averaged 8,090,560 registrants across the observed versions. The dataset showed a minimum of 7,995,785 voter registrations on July 22 and a maximum of 8,157,892 on October 12, with a standard deviation of 48,799.
Approximately 80 percent of all voter registrations were classified as active. The average number of active voters was 6,448,306, ranging from a minimum of 6,345,953 on September 7 to a maximum of 6,555,166 on November 2, with a standard deviation of 75,848.
About one-fifth of all voter registrations were marked inactive. The average number of inactive voters was 1,642,253, with the counts varying from a maximum of 1,709,660 on June 1 to a minimum of 1,468,071 on August 17, and a standard deviation of 75,632. Figure 7 offers a detailed summary of these statistics, while Figure 8 and Figure 9 provide visual representations.
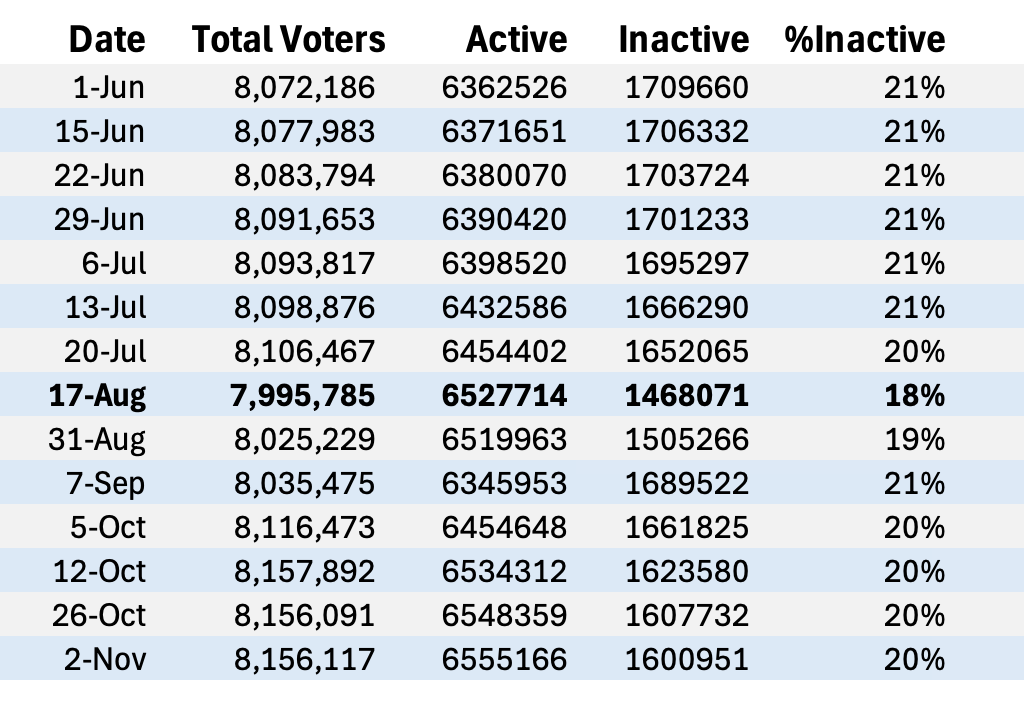
Figure 7. Summary statistics for the Ohio voter data over time, from June 1 through November 2, 2024. Bold row is the first observation after scheduled removal of the registrations of the Subjects.
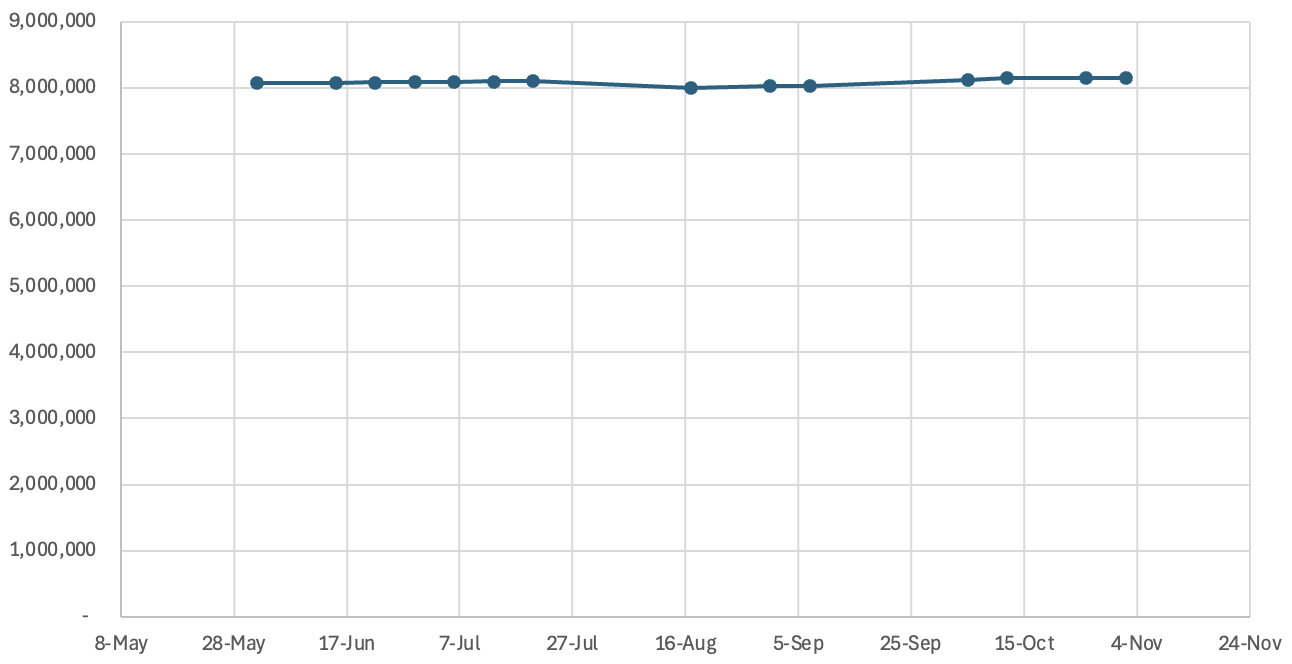
Figure 8. Total number of voter registrations in the Ohio voter data over time, from June 1 through November 2, 2024. The dip (7,995,785 voters) appeared on August 17, 2024, just after the removal of any Subjects who had not updated their registrations. The maximum number of registrations (8,157,892 voters) was on October 12.
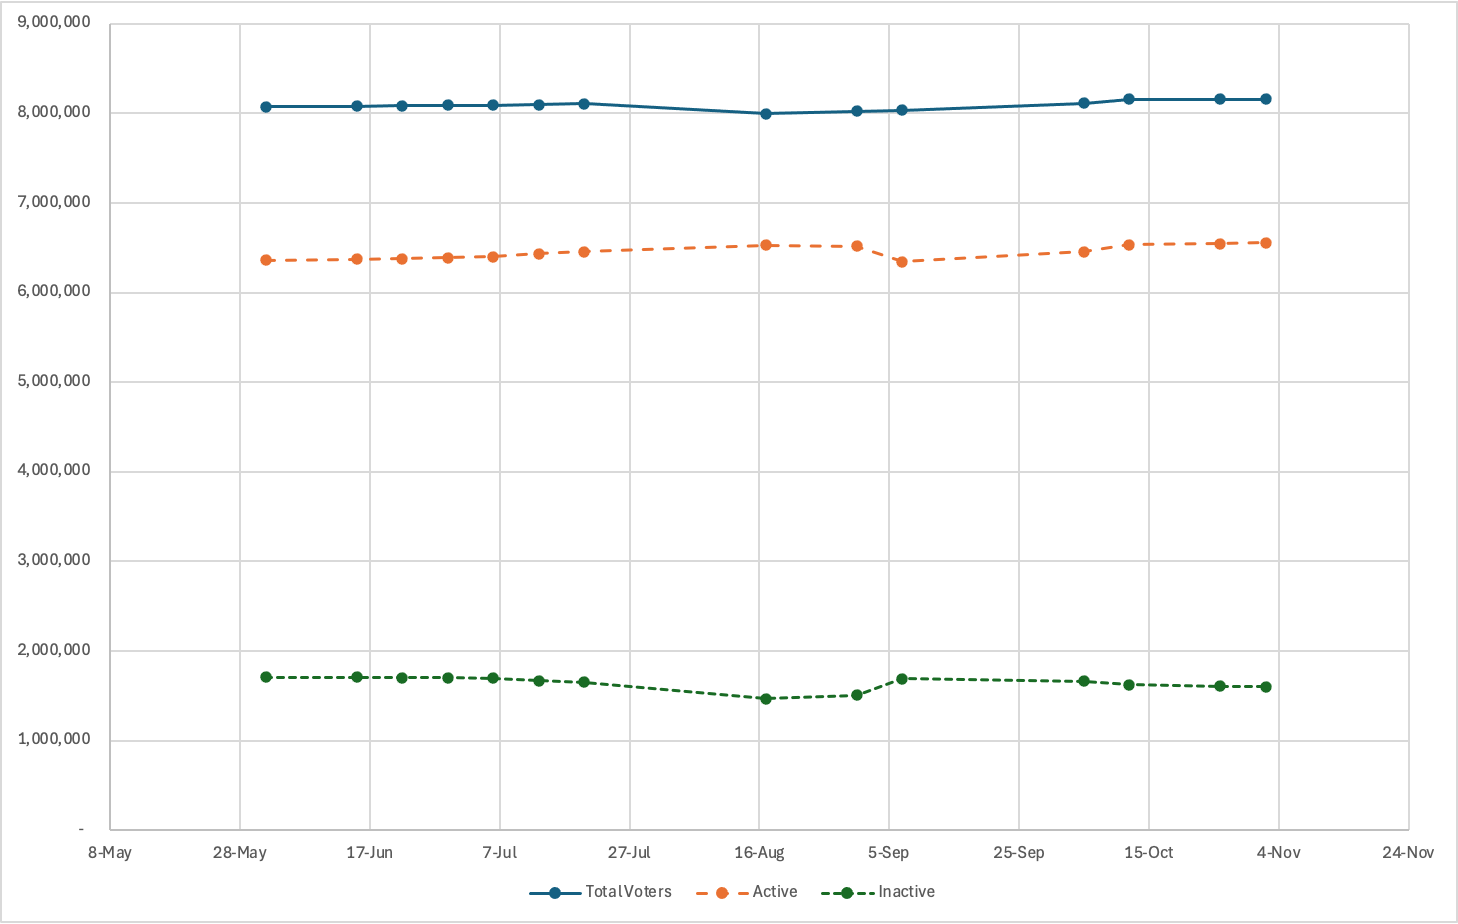
Figure 9. Total number of voter registrations in the Ohio voter data over time, from June 1 through November 2, 2024 with breakdowns of active and inactive voters.
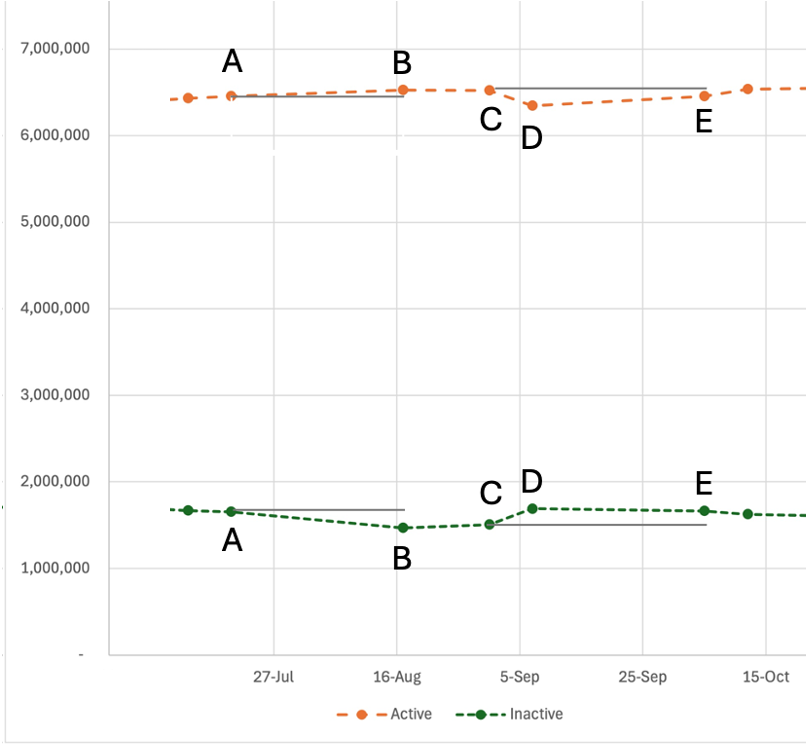
Figure 10. Enlargement of observation points that showed gross changes in active and inactive registrations. These registrations were not part of the publicly announced removals. A to B is from July 20 to August 17. C, D, and E are August 31, September 7, and October 5, respectively.
The sharp decline in voter registrations, most prominently illustrated in Figure 8, occurs immediately after the designated Deadline Date for removing Subjects. The lowest voter count (7,995,785 total registrations) was on August 17, 2024, shortly after the removal deadline. Figure 10 provides a closer look at this period. The interval from July 20 to August 17 (A to B) aligns with the scheduled removal of Subjects, during which there was a net decrease of 110,682 voter registrations. Despite this temporary drop, the overall trend in voter registration reflects a net increase of 192,640 voters between the start and end of the observation period, from June 1 to November 2, 2024.
II. Tracking Changes in Voter Data by VoterID
Each voter registration has a unique identification code (“VoterID”), enabling precise tracking of status updates, additions, and deletions within the voter data. Notably, this unique identifier relates to the registration itself rather than the individual voter. If a voter re-registers, the new registration receives a different unique identifier. By monitoring these registration identification numbers over time, we can report on the following:
- The number of registrations newly classified as active or inactive,
- Registrations that remained unchanged in their status (active or inactive),
- Transitions between statuses (active to inactive or inactive to active), and
- Registrations dropped altogether.
Figure 11 presents a detailed breakdown of voter registration status changes over time, tracking VoterIDs across the observed periods of voter data. The most notable shifts occurred on October 5, when 130,018 voters registered as active just in time for the November election, accompanied by 7,535 voters transitioning from inactive to active status.
As October transitioned into the November election period, the largest number of unchanged active registrations (6,547,848) was recorded. In contrast, the highest number of unchanged inactive registrations—exceeding 1.7 million—was observed in June.
Significant transitions between statuses were also noted. The largest shift from active to inactive occurred on September 7, while the greatest number of transitions from inactive to active was recorded on October 5. The most significant decline in overall voter registrations—totaling 185,037—occurred on August 17, immediately following the Deadline Date.
A total of 109,119 voter registrations were removed within 90 days of Election Day (see August 31 through November 2 in Figure 11). This is surprising, as it occurred after the Deadline Date and involved a group of voters comparable in size to Subjects. Given the proximity to the election, these voters had limited time to be informed about their removal, let alone take corrective action. (See [27] for an analysis of these voter registration changes.)
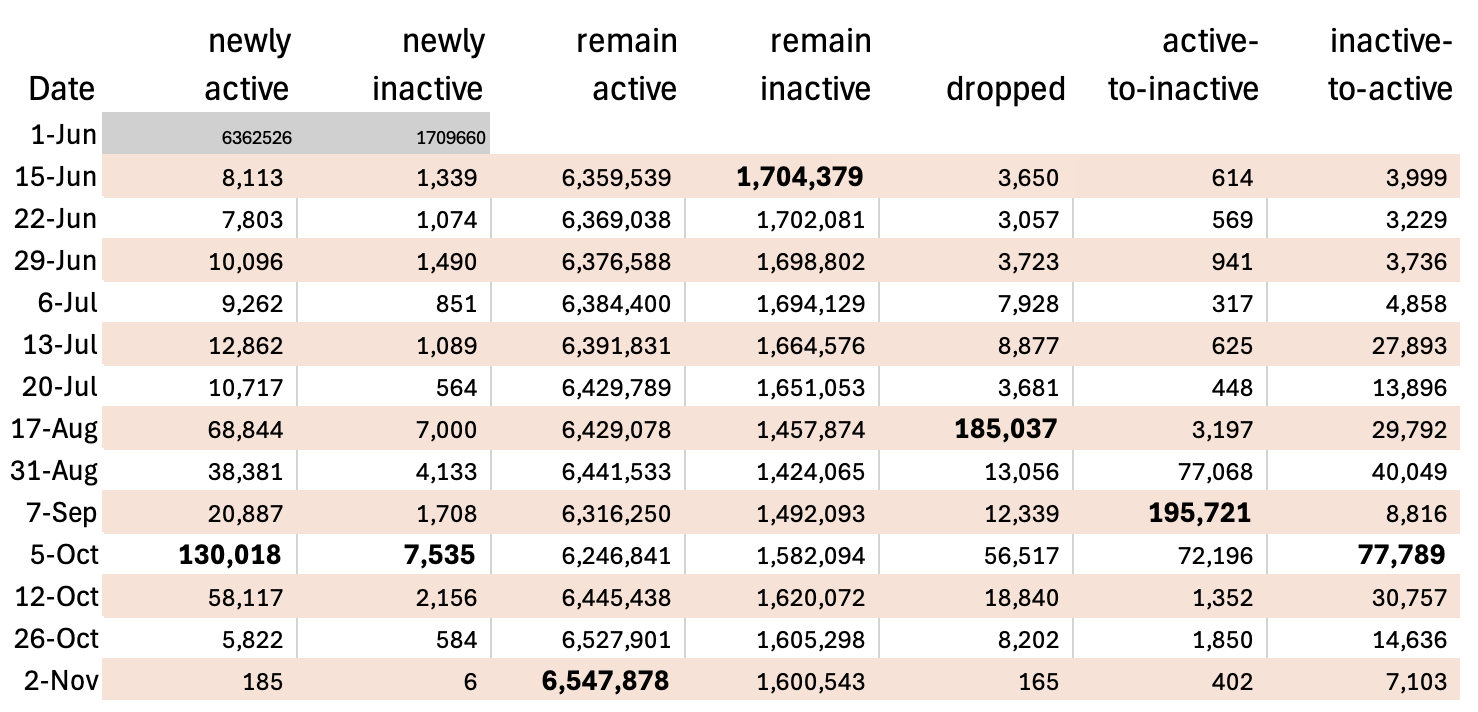
Figure 11. Changes in the voter status of registration from subsequent observations of voter registration IDs. Values in bold are the largest values in each category.
III. Subjects: Residences
So far, our analysis has centered on aggregate voter data. The following findings narrow the focus to the 158,857 voter registrations designated as Subjects—registrations scheduled for removal on the Deadline Date unless voters took corrective action. Available data for these Subjects includes their addresses, as detailed in Figure 3.
Subjects came from 1,047 municipalities across Ohio. In 2024, Ohio's most populous cities were Columbus (913,175), Cleveland (362,656), Cincinnati (311,097), Toledo (265,304), and Akron (188,701) [28]. These cities also have the highest number of Subjects, with Cincinnati representing the largest share—18,214 Subjects, or 11 percent of the total. In contrast, 70 cities had only one identified subject.
On average, municipalities had 151 Subjects, with a standard deviation of 848, reflecting substantial variability. The median number of Subjects per municipality was much smaller at 24, illustrating the uneven distribution of affected voters across municipalities.
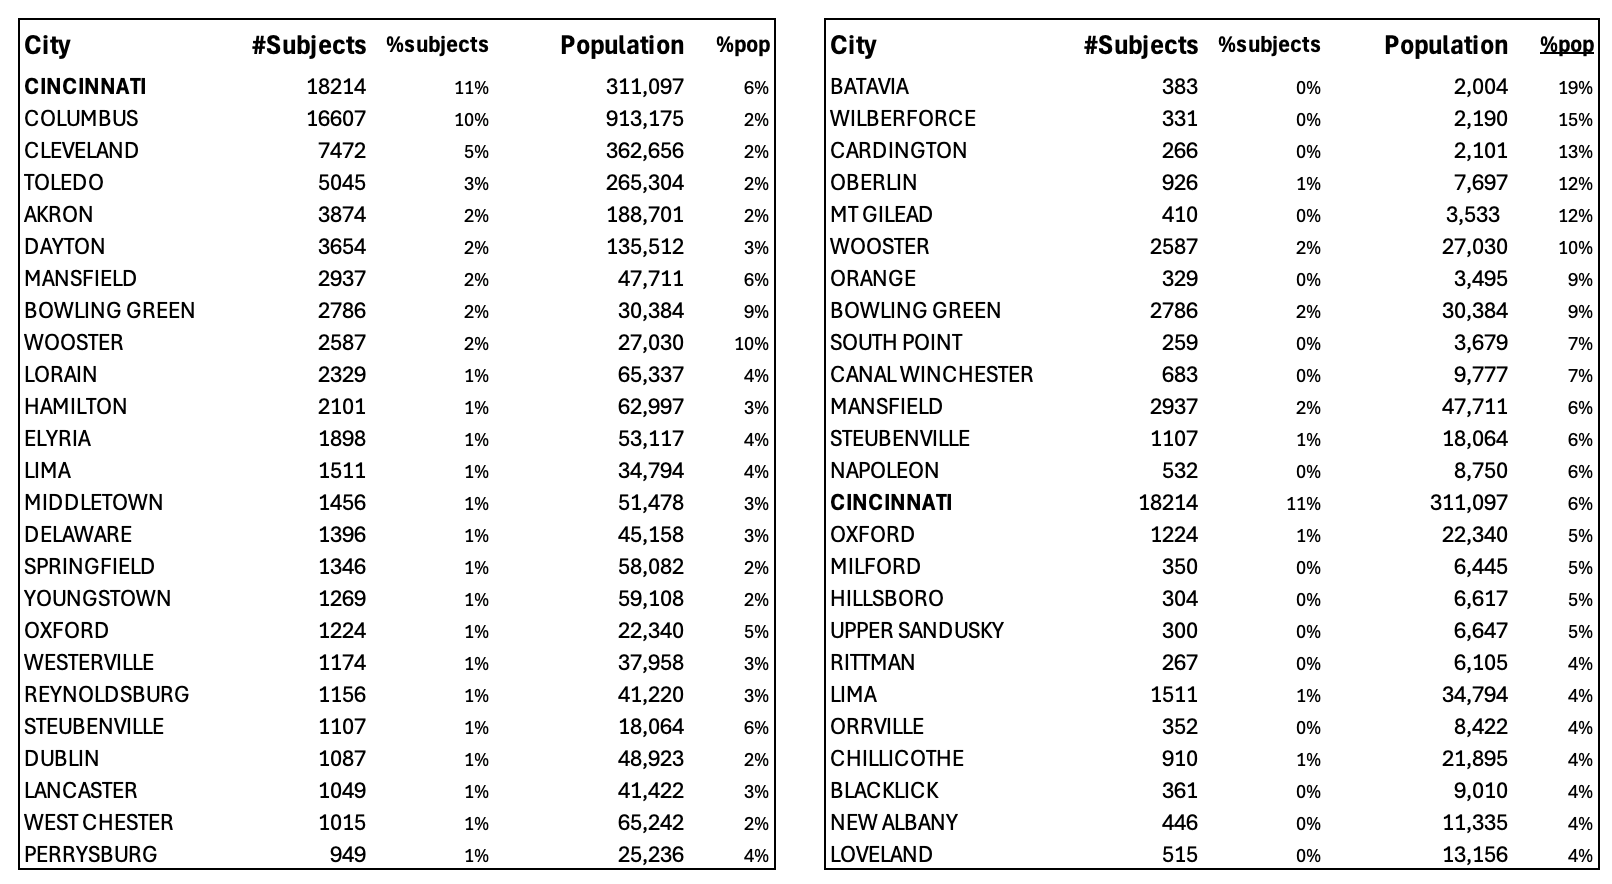
Figure 12. Municipality having the greatest numbers of Subjects (left) and highest percentage of Subjects relative to population (right).
Figure 12 highlights the top 25 cities with the highest numbers of Subjects and includes the percentage of each city’s population represented by Subjects. This provides a clearer understanding of the relative impact across cities. Notably, some smaller communities had a significant proportion of Subjects: nearly one in five residents of Batavia were Subjects, while three in every 20 residents in Wilberforce fell into this category. Even in Wooster, with a population nearly three times that of Batavia, one in ten residents were Subjects.
Figure 13 presents a heat map visualizing the distribution of Subjects based on their city of residence. As expected, the brightest areas correspond to Cleveland, Cincinnati, and Toledo, reflecting their large populations. However, the highlighted region around Wheeling, West Virginia includes Subjects from dozens of smaller towns in the surrounding area, showcasing a more dispersed pattern. The heat map also reveals that Subjects in Cincinnati are concentrated into a smaller area, whereas those in Cleveland and Columbus are more dispersed.
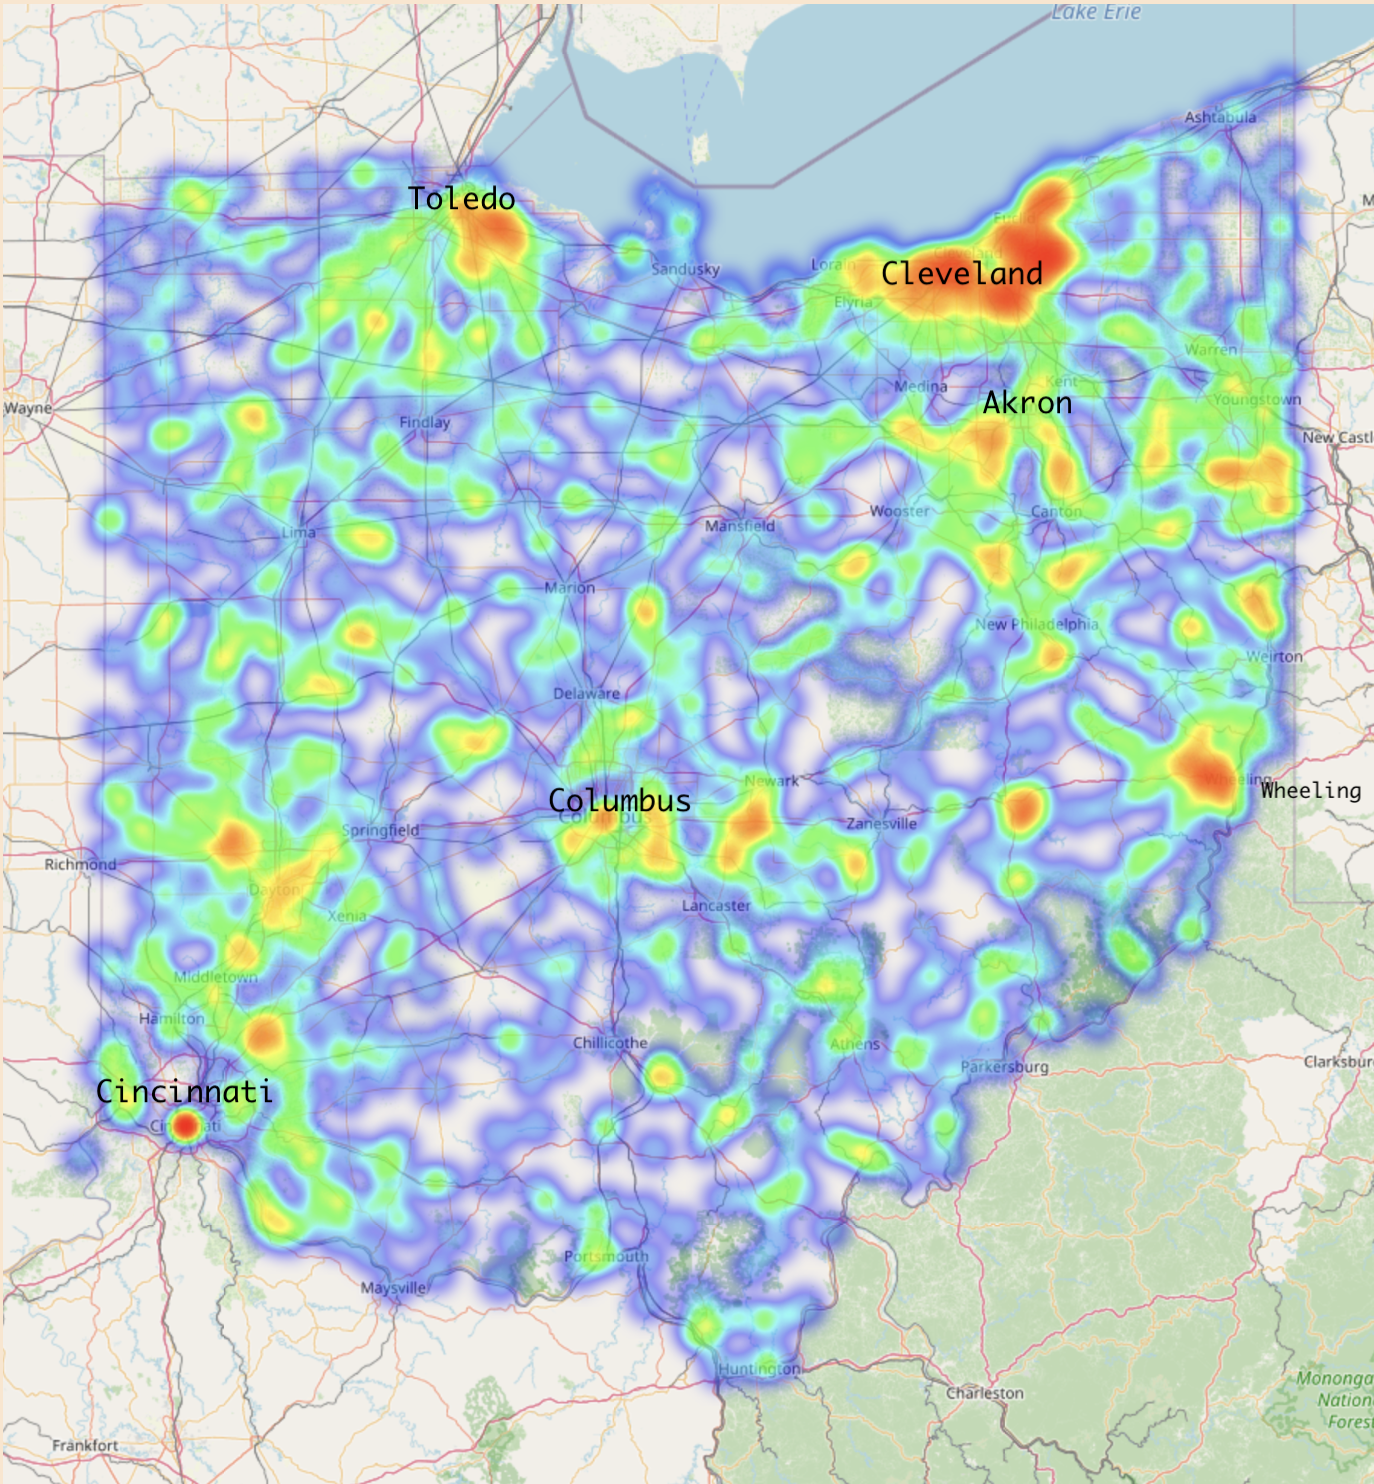
Figure 13. Geographical heat map of the residences of Subjects. The greater the number of Subjects in a geographical area, the brighter the coloring. The highest concentrations of Subjects appear as red areas.
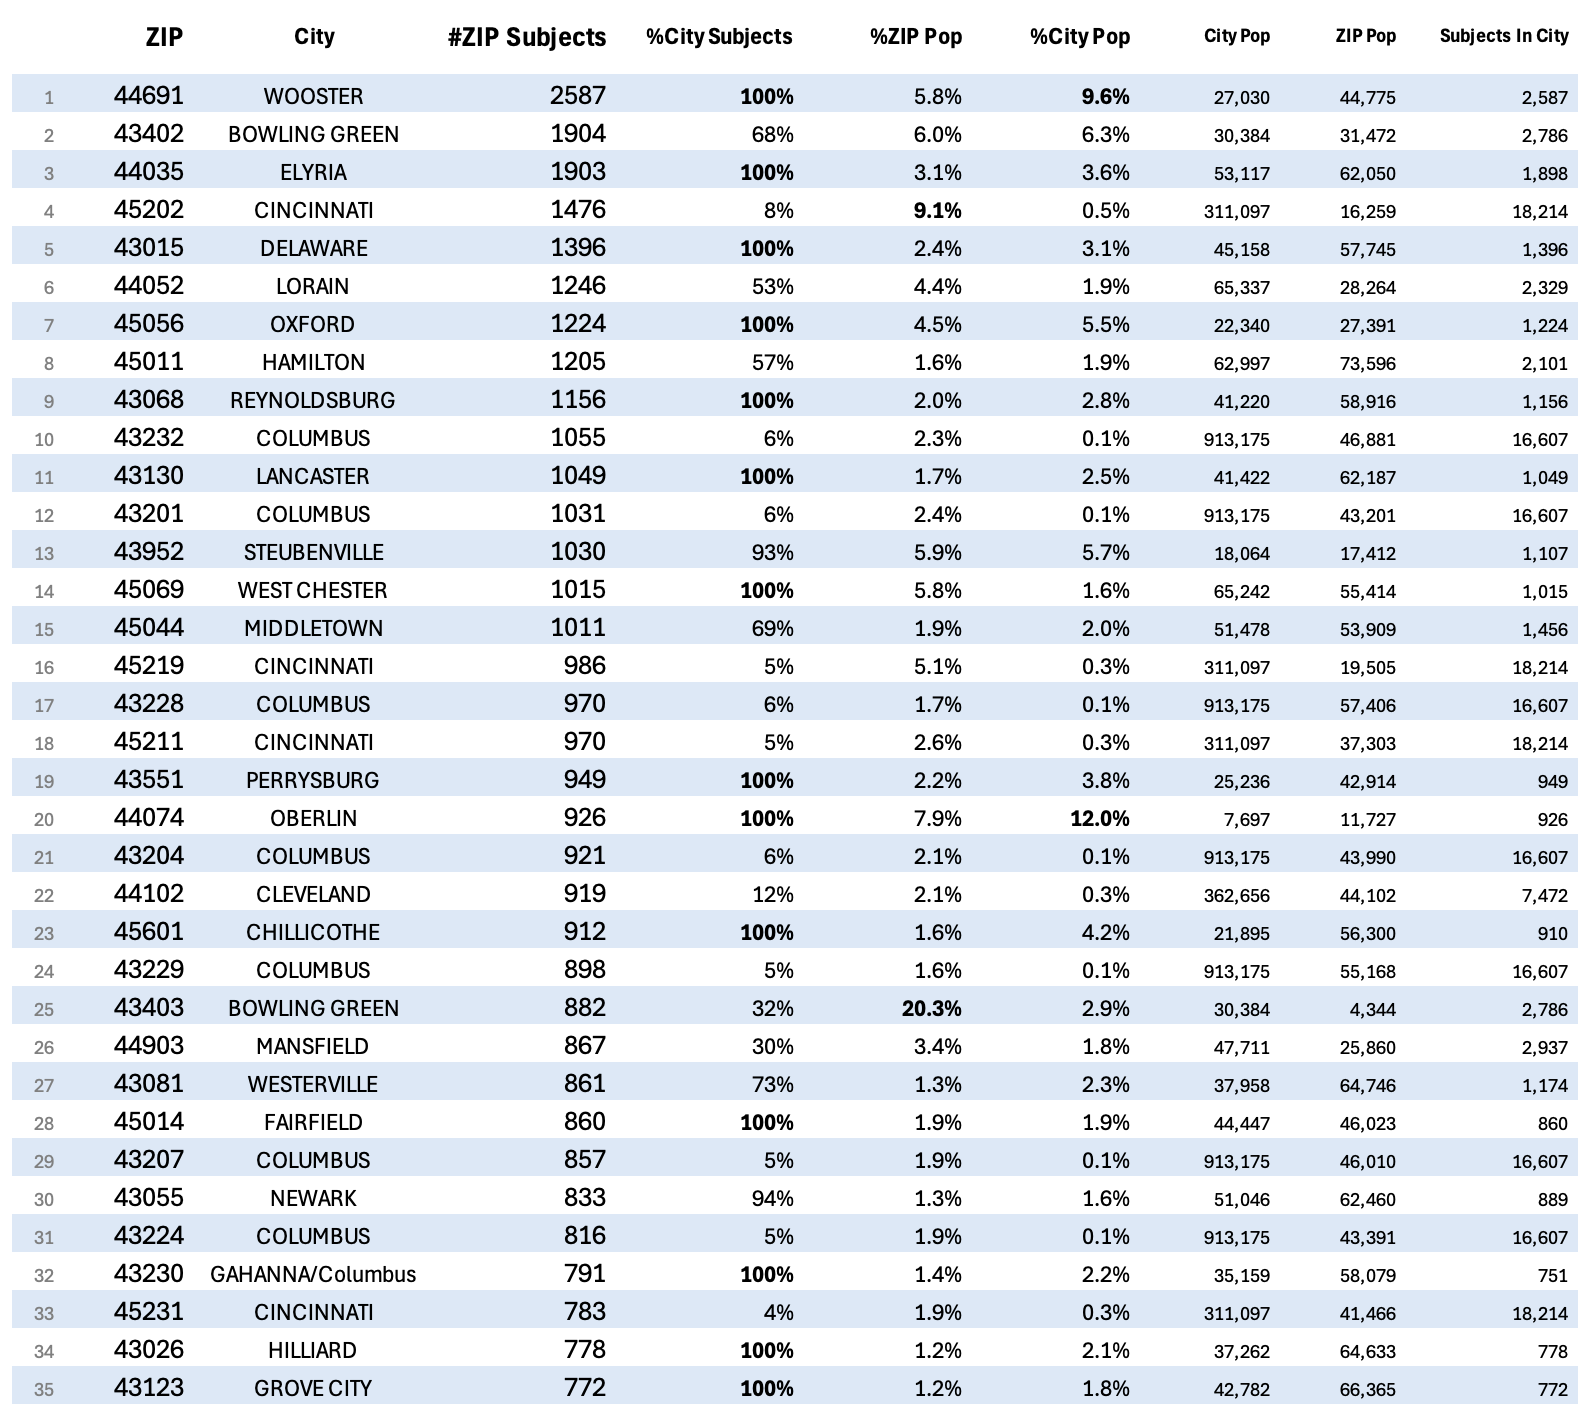
Figure 14. The 35 ZIP codes that have the highest concentrations of Subjects, along with the population and percentage of Subjects in the ZIP code and city.
Examining subject residences by ZIP code offers deeper insights into their geographical distribution. Figure 14 presents a detailed breakdown of the 35 ZIP codes with the highest number of Subjects.
Subjects were distributed across 1,302 ZIP codes in Ohio. Among cities, Cincinnati had the highest number of unique ZIP codes (45), followed by Columbus (30), Cleveland (23), and Dayton (23). However, the number of Subjects within these ZIP codes varied significantly.
The ZIP code with the highest concentration of Subjects is 44691 in Wooster, Ohio. All 2,587 of the Subjects in Wooster live in this single ZIP code, representing about ten percent of the city’s population. Notably, Figure 14 reveals that nearly half of the most populated ZIP codes include all the Subjects from their respective cities (see the rightmost column in Figure 14).
Cleveland had only one ZIP code (44102) among the top 35, while Columbus and Cincinnati had seven and four ZIP codes, respectively, in the list. Figure 14 provides further details on the distribution of Subjects across these key ZIP codes, along with the population of each ZIP [29] for perspective.
The distribution of Subjects across the state is uneven. While the largest cities account for the highest number of Subjects, certain small towns and specific ZIP codes have a disproportionately high concentration relative to their population.
IV. Subjects: Political Party Affiliation
In Ohio, a voter’s party affiliation is determined by their participation in a political party’s primary election within the past two calendar years [30]. Voters who cast a ballot in a party’s primary but did not vote in another party’s primary during that period are considered affiliated with that party. Conversely, voters who did not vote in any partisan primary within the past two years are classified as unaffiliated. As a result, party affiliation numbers fluctuate over time, largely influenced by voter participation in primary elections.
The June 1st version of the Voter Data included a total of 8,072,183 voter registrations, comprising 1,504,791 Republicans (19 percent), 815,066 Democrats (10 percent), and 5,752,326 voters (71 percent) with no designated party affiliation. As noted, the majority of records in the Voter Data lack a political party designation.
All registrations for Subjects had an undesignated party affiliation. Given that Subjects were selected based on inactivity, relocation, or death, it is notable that none were affiliated with a political party. But recently deceased individuals who did vote in a primary election within the last two years would have a party affiliation. The absence of any party affiliation suggests that the Subjects did not include recently deceased voters.
The National Institutes of Health reports that in Ohio the age-adjusted death rate is 911.8 deaths per 100,000 residents [31]. Given this rate, we would expect approximately 1,448 of the 158,857 Subjects to be recently deceased, potentially more given the characteristics of the Subjects.
In the Voter Data, 29 percent of all voters had a recorded party affiliation due to voting in a primary election. There is no reason to assume that the recently deceased participated in primaries at a significantly different rate than other voters. Based on this expectation, we would anticipate that around 419 deceased Subjects should have had a recorded party affiliation.
However, none of the Subjects in the data had a party affiliation, suggesting that the announced removals may have included very few, if any, deceased voters. This raises questions about whether the criteria used for identifying Subjects for removal fully captured recently deceased individuals.
Also, party affiliation could not have been removed after the Subjects were selected for removal, as our earliest observation of the data predates the public announcement identifying the voters who would become Subjects. In those earlier records, Subjects had no party affiliation.
V. Subjects: Identification
Matching each subject's name and address to the June 1 voter data yielded 157,413 unique matches, accounting for 99 percent of all the Subjects. These matches enable the unique association of 99 percent of the Subjects with their voter registration identification numbers, statuses, and dates of birth. For the remainder of this analysis, these registrations are referred to as the Uniquely Matched Subjects.
The high match rate confirms that name and address serve as reliable identifiers. Consequently, we used these identifiers in subsequent analyses to track voter registrations accurately, examine changes in voter status, and identify new or removed registrations by linking Subjects to their names, addresses, and dates of birth.
For the remaining one percent of subject registrations that did not yield a unique match, no record was found for 452 names and addresses. This suggests that these records were already removed from the voter data prior to June 1, when the announcement was made.
The list of names and addresses announcing the Subjects itself contained 372 duplicate entries, where two rows listed the same name and address. Matching the list to voter records resulted in 620 ambiguous cases, where each entry corresponded to two different voter registrations. These registration pairs shared the same name and address but differed in date of birth and voter registration number.
Below is a summary of the results from matching the names and addresses of the Subjects with the June 1 voter data:
157,413 Unique matches based on Name and Address (Uniquely Matched Subjects)
620 Duplicate matches based on Name and Address
452 No match found for Name and Address
372 Duplicate entries found in Subject Data
—-------- —--------------------------------------------------------------------------------------------------
158,857 Total Subjects
We utilized data broker information to examine the most frequent associations of name, address, and date of birth, offering insights into ambiguous matches. Among the 620 cases where voter registrations were indistinguishably matched by name and address, at least one corresponding record for the same name and address was found in the data broker database for every instance.
A closer examination revealed that in 402 cases (65 percent), the two registrations associated with the same name and address had differing dates of birth. Many of these instances involved family members who shared the same name but had missing suffixes (e.g., "Jr." or "Sr.") in the voter registration records, leading to unintended duplicate matches.
Additionally, comparisons showed that year of birth alone provided a more reliable match to known individuals in data broker records than the full date of birth (month, day, and year) in 428 cases (69 percent) of dual registrations. This suggests that full birthdates in the Voter Data may not be as accurate for matching to other information as using the year of birth, in combination with name and address, to enhance accuracy when matching voter registrations.
VI. Subjects: Age Information
We analyzed the age distribution of the Subjects who uniquely matched voter registrations by using their decade of birth, excluding 215 records with invalid date values. Figure 15 illustrates this distribution. The oldest Subjects were born in the 1910s, while the youngest were born in the 2000s. The average year of birth is 1974, corresponding to a current age of approximately 50, while the median year is 1980, reflecting a typical age of 44. Notably, the 1980s and 1990s together account for 59 percent of the Subjects, meaning that most Subjects are between 24 and 44 years old.
Residential mobility generally decreases with age. For instance, during 2017–2018, 25 percent of individuals in the United States aged 18–24 moved, compared to only six percent of those aged 65 and older [32]. The concentration of Subjects in younger age groups suggests that more than half may have relocated. In a forthcoming subsection, we will analyze whether those who moved elsewhere within the same city, county, or state registered again under the same name and date of birth.
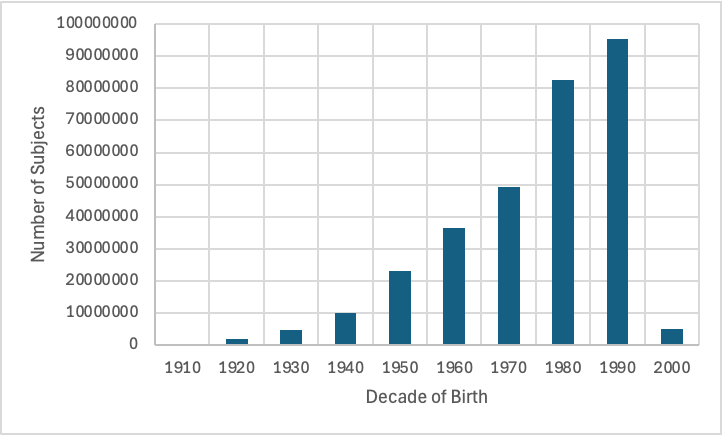
Figure 15. Distribution of the decade of birth for Subjects that uniquely matched to voter data on name and address.
VII. Subject Tracking by VoterID
As previously reported, of the 158,857 Subjects, 452 were not found in the June 1 data, indicating prior removal. The remaining 157,413 Subjects (99 percent) matched uniquely to a voter registration record, and these are the Uniquely Matched Subjects. Recall, each voter registration has a unique identification code, or voter registration ID, enabling us to track the status of specific registrations over time.
Before the public announcement, 82 of the Uniquely Matched Subjects had an active status, raising questions about their inclusion as Subjects. However, the vast majority (157,331) were inactive.
After the Deadline, 153,435 registrations (97 percent of the Uniquely Matched Subjects) were removed, while 2,405 were active, and 617 were inactive.
By Election Day, 152,976 registrations (97 percent) of the Uniquely Matched Subjects remained removed, while 3,621 were on the voter roll as active and 816 as inactive. This indicates that 4,437 registrations (three percent of the Uniquely Matched Subjects) had undergone sufficient updates to remain on the voter roll by Election Day under their original voter registration ID. Figure 16 provides a detailed summary of these changes over time.
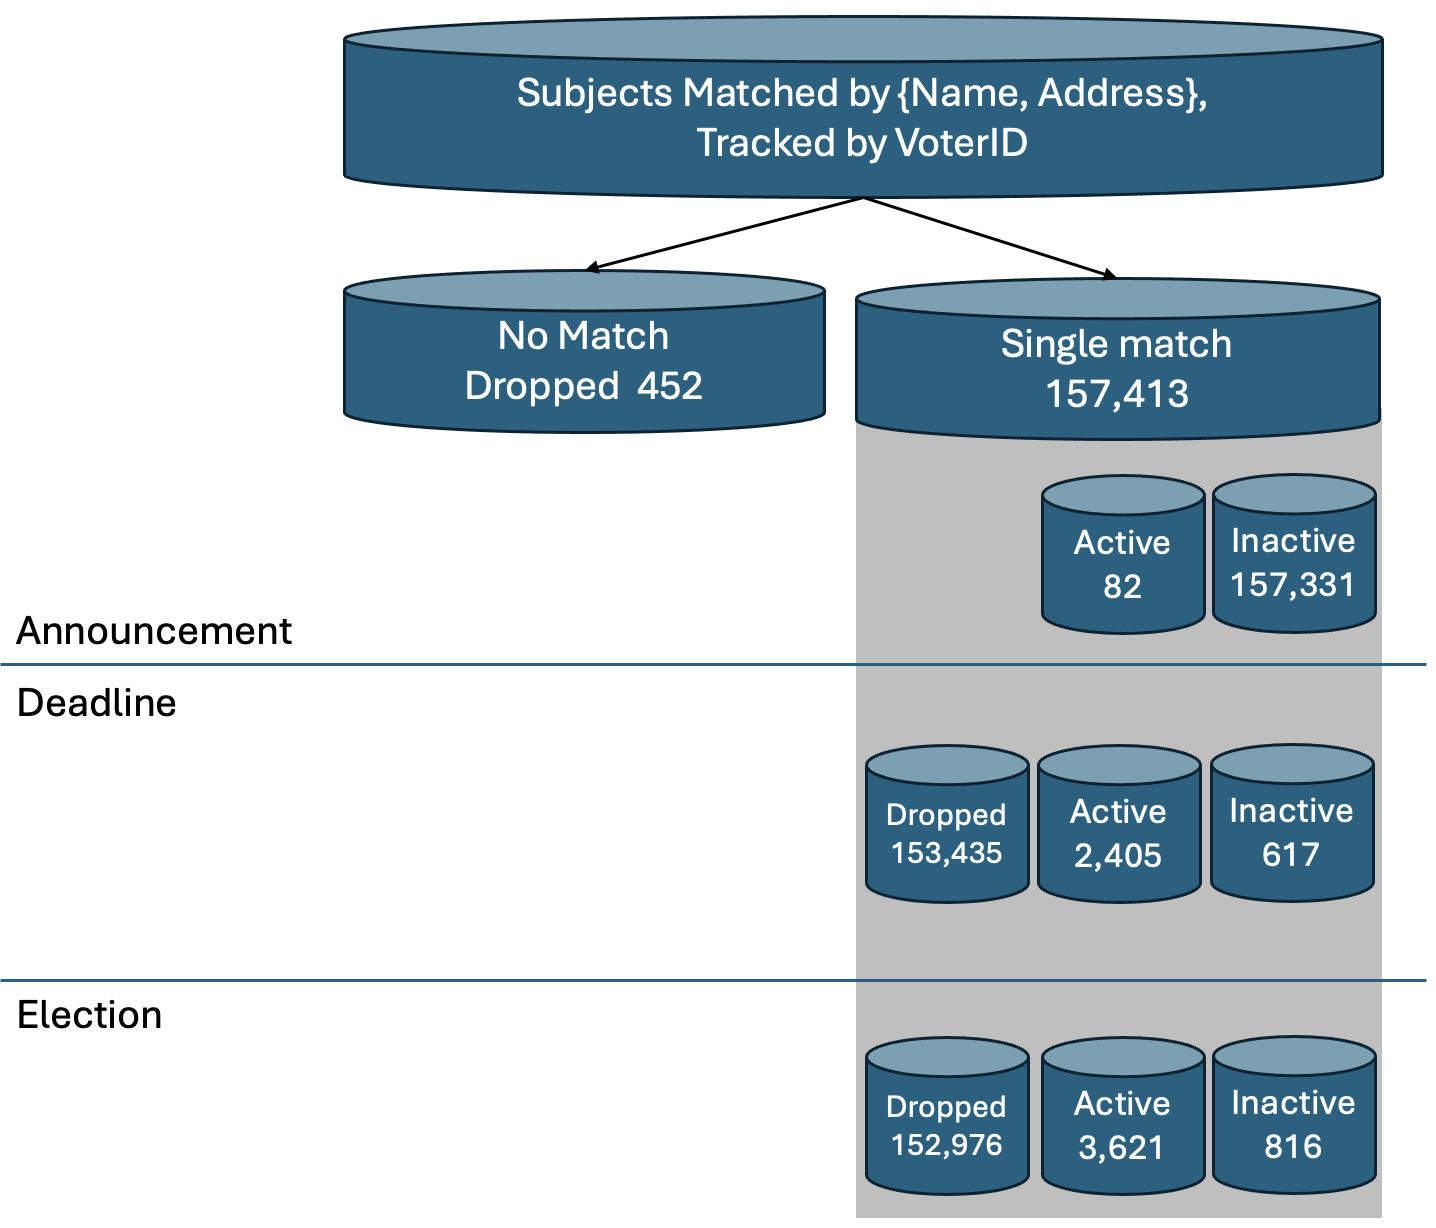
Figure 16. Tracking of the status of the VoterIDs of the Uniquely Matched Subjects before the Announcement, and after the Deadline and Election. A total of three percent (4,437=3,621+816) of the single- matched Subjects were in Voter Data by Election Day.
VIII. Subject Tracking by Name and Age
Tracking each subject's name and full date of birth (month, day, and year) in the Voter Data provides an additional method for monitoring changes to the voter registrations of Subjects. As detailed in Figure 17, a total of 156,664 (99 percent) of the 158,857 Subjects had unique name and date-of-birth combinations. Immediately following the Deadline Date, 152,896 (97 percent) of these registrations were removed, while 3,970 remained listed. By Election Day, matches based on name and full date of birth revealed that 6,853 Subjects (4 percent) had reactivated their registrations, while 150,512 (96 percent) remained removed from the voter rolls.
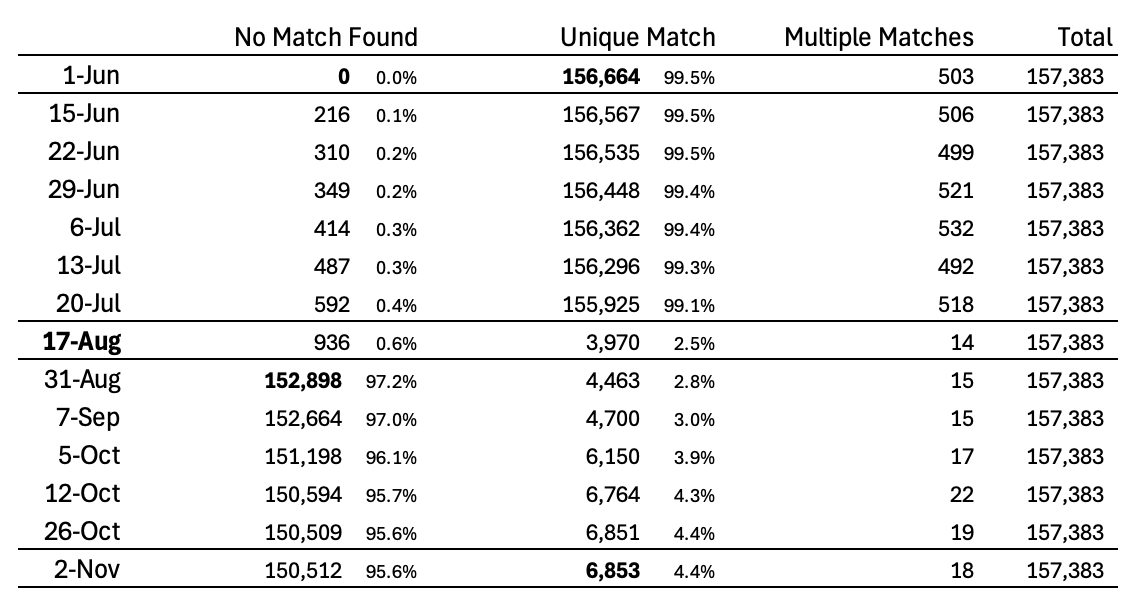
Figure 17. Tracking of the status of voter registrations for Subjects by name and date of birth (month, day, and year) before the Announcement (June 1), after the Deadline (August 17), and at the Election (November 2).
As reported earlier, full dates of birth in the Voter Data are not always accurate, with the year of birth being a more reliable indicator. When tracking Subjects by name and year of birth, the number of unique matches decreases to 137,576, representing 86 percent of the 158,857 Subjects. Among these voters with a unique combination of name and year of birth, 134,326 (98 percent) were removed after the deadline. However, by Election Day, 15,484 (10 percent) of Subjects reappeared as active in the Voter Data based on unique combinations of name and year of birth. These findings are detailed on Figure 18.
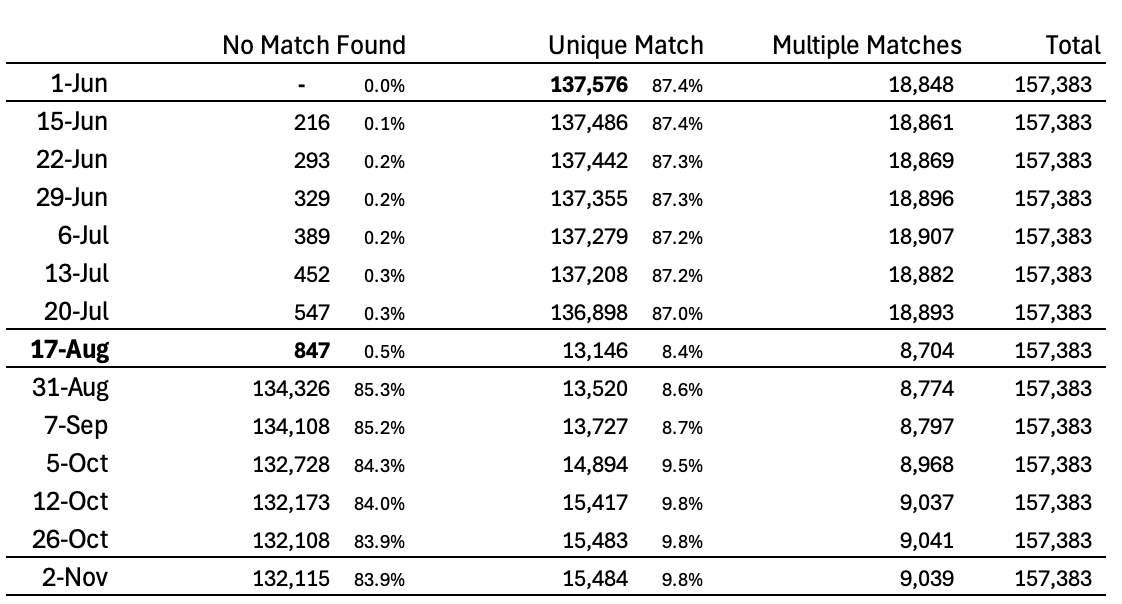
Figure 18. Tracking of the status of voter registrations for Subjects having unique name and year of birth before the Announcement (June 1), after the Deadline (August 17), and at the Election (November 2).
IX. Erroneous Removal Rate
As previously discussed, Voter Data is inherently imperfect due to population changes, and the selection of Subjects will reflect some degree of inaccuracy. However, the selection process should aim to minimize errors that include voter registrations capable of reappearing on Election Day under the same name and address. This study evaluates how many of the Subjects were present in the Voter Data on Election Day with the same name and address, even if they had been assigned a new voter registration number. These voters had to take corrective action solely because they were wrongly identified as Subjects. This analysis provides a baseline measure of the minimum number of voters who were adversely affected by their inclusion as a Subject.
We introduce and define the Erroneous Removal Rate (ERR) as the proportion of voters mistakenly identified for removal but who later reappeared in the Voter Data after taking corrective action. These voters had to actively reinstate their registrationsthemselves afterdue to being having been incorrectly classified as Subjects for removal. An ERR does not necessarily indicate a mistake by an election official; rather, it may reflect issues within the overall process. It serves as a metric for assessing the accuracy of the outcomes produced.
The ERR does not include Subjects who appear in the Voter Data on Election Day with a different name or at a different address. The ERR can be calculated for specific geographic regions, not just statewide.
Voter registrations in the Voter Data fall into two categories:
(a) Voters who are eligible to vote and reside at the address listed.
(b) Voters who are not eligible to vote or no longer reside at the address listed.
Ideally, the selection process for Subjects should exclusively target group (b)—registrations that belong to ineligible voters or those who no longer reside at their registered address. Any inclusion of group (a) represents an error, contributing to the Erroneous Removal Rate (ERR), which measures the extent to which eligible voters are mistakenly flagged for removal.
However, ERR is not the only error relevant to voter list maintenance. Another critical consideration is missed removals—overlooked registrations in group (b) that remained in the voter rolls despite being ineligible or inactive for the same or longer period. We introduce and define this as the Missed Removal Rate (MRR). This study does not examine missed removals but acknowledges that a comprehensive evaluation of voter list maintenance requires analyzing both erroneous removals and missed ineligible registrations. Figure 19 provides an overview of these classifications.

Figure 19. Two- by- two matrixexplanation of the possible errors (ERR and MRR) made in the identification of Subjects by list maintenance.
To calculate the Erroneous Removal Rate (ERR) for Subjects, we compare the names and addresses listed in the removal announcement to those in the final Voter Data observation on November 2, just before Election Day. Our analysis includes both exact and fuzzy matching to account for minor variations, such as the addition or omission of unit numbers, alternative spellings of addresses or city names, and ZIP code updates that retainedwhile maintaining the same street address.
The comparison reveals that 1,761 Subjects (one percent) had exact matches in the November 2 Voter Data, while 2,395 (1.5 percent) had fuzzy matches. Based on these findings, the Erroneous Removal Rate (ERR) for Subjects falls between one and 1.5 percent.
Figure 20. Comparison of the age distribution ofative age information between all Subjects withand the ERR Subjects by decade of birth.
The percentage of erroneously removed Subjects (“ERR Subjects”) born in the 1950s or earlier were overrepresented in the erroneously removed contingent (“ERR Subjects”)was consistently greater compared tothan for those born in later decades than for all Subjects, suggesting an adverse impact on older Subjects (see Figure 20). While the average year of birth is the same for both all Subjects and ERR Subjects (1974), the median year of birth is older among ERR Subjects—1976 compared to 1980—further indicating a modest age-related disparity (see Figure 21).
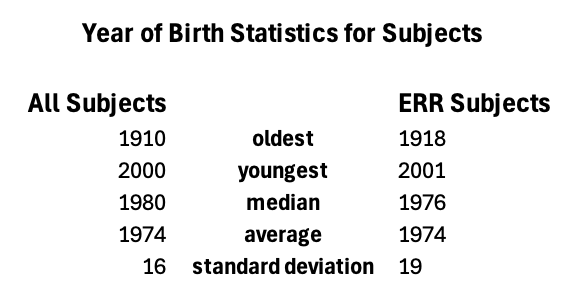
Figure 21. Comparison of descriptive statistics for birth years of all Subjects and the ERR Subjects by decade of birth.
Figure 22. The counties having (a) the greatest number of Subjects, (b) the greatest number of ERR Subjects, and (c) the largest ERR (Eerroneous Rremoval Rrate).
Specific list maintenance responsibilities are carried out at the county level. The counties with the largest number of Subjects are Franklin (23,106), Hamilton (18,003), and Cuyahoga (14,725)—home to Ohio’s largest cities: Columbus, Cincinnati, and Cleveland, respectively. See Figure 22a for a list of thefull breakdown of counties with the highest number of Subjects.
However, the distribution of ERR Subjects (erroneously removed voters in the state) reveals a different pattern. While larger counties like Hamilton contribute substantially to the total number of ERR Subjects, Trumbull County—ranked 24th in total Subjects—has the fourth highest number of ERR Subjects (see Figure 22b) and the highest ERR rate for a county in the state, at 6.3 percent (Figure 22c). This rate is nearly double that of Hamilton County. In total, 92 of the 1,461 Subjects from Trumbull County were erroneously removed, requiring those voters to take additional steps to restore their registration by Election Day.
In summary, Franklin County had the largest number of Subjects (23,106), while Hamilton County recorded the highest number of ERR Subjects (605) among all counties. However, Trumbull County had the highest ERR rate, with 6.3 percent of its Subjects erroneously removed—the largest percentage of a county in the state.
At the local level, the disparity in Trumbull County becomes even more pronounced. Warren, Niles, Girard, and Cortland are places in Trumbull County, with each having more than 100 Subjects.
- Warren has the highest number of Subjects at 635, with an ERR of 7 percent.
- Niles has 146 Subjects and an ERR of 3 percent.
- Girard shows the highest local ERR, with 123 Subjects and an ERR of 9 percent.
- Cortland has 109 Subjects and an ERR of 3 percent.
All four places report ERRs that substantially exceed the statewide standard of 1 percent, underscoring a localized pattern of disproportionately high erroneous removals within Trumbull County.


